#2 - Behind The Cloud: Time Series Forecasting (2/7)
May 2024
In our quest to unlock the mysteries of future market behaviors through Time Series Forecasting (TSF), a foundational step is to understand the building blocks of the very subject at its core: time series data.
After the introduction last week, we delve into the anatomy of time series data, a crucial element that serves as the bedrock for all forecasting endeavors, especially within the complex web of financial markets.
Time series data is essentially a sequence of data points collected, recorded, or observed over a period. In finance, this could be anything from daily stock prices, quarterly earnings reports, monthly bond yields, to annual inflation rates. The distinct characteristic of time series data is its chronological order, which holds the key to identifying patterns that inform future predictions.
To analyse time series we can split it into simpler building blocks. Looking at its components can simplify its analysis and reveal the patterns that were previously not obvious. The most commonly analysed components are:
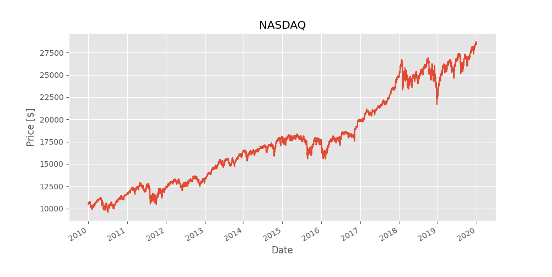
Trend: This is the long-term movement in the data over time, which can be upward, downward, or not be pronounced. In financial markets, identifying a trend is crucial for strategic investment, as it indicates general market directions.
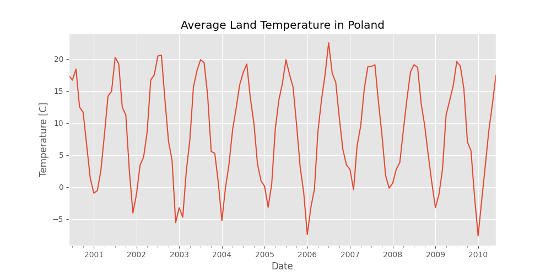
Seasonality: These are patterns that repeat over a known, fixed period, such as the end-of-year rally in stock markets or the quarterly fluctuations in corporate earnings reports. Recognizing seasonality allows investors to anticipate short-term movements and make timely decisions.
Cyclical Changes: Unlike seasonality, cyclical changes do not follow a fixed schedule but are influenced by broader economic cycles, lasting years or even decades. These cycles are crucial for long-term investment strategies, as they can signify periods of expansion or contraction in the economy.
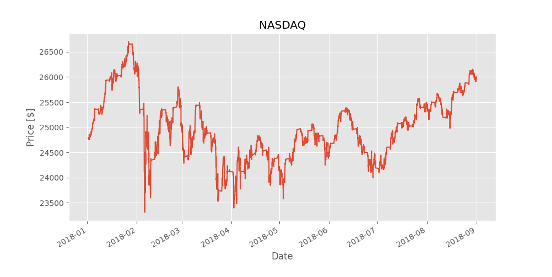
Irregularities: These are unpredictable, random fluctuations that cannot be attributed to trend, seasonality, or cycles. In finance, irregularities can result from unforeseen events like geopolitical tensions, natural disasters, or sudden regulatory changes.
For institutional investors (and financial journalists as relevant multiplier), the ability to dissect and understand these components within time series data is paramount. It not only aids in making more accurate forecasts but also in crafting narratives that resonate with reality and anticipate future shifts.
“In data we trust”
However, the journey from raw data to insightful forecast is fraught with challenges. Data must be meticulously cleaned, analyzed, and tested against various forecasting models to distill meaningful patterns. This process, while demanding, is essential for the creation of forecasts that have real-world applicability and can guide strategic decision-making. Moreover, in the digital age where data is abundant, the skill lies not just in analysis but in discerning which data is truly relevant. This discernment is what separates the novice from the skilled forecaster, enabling the latter to make predictions that are not just educated guesses but informed estimations.
Next week, we will explore the realm of statistical models in TSF. These models, which range from the simple to the sophisticated, are the tools that analysts and investors use to turn the patterns identified in time series data into actionable forecasts.
Understanding the anatomy of time series data is akin to a cartographer mapping uncharted territory. For our institutional investors and journalists, it’s the first step in navigating the vast, volatile ocean of financial markets with confidence. It’s not just about predicting the future; it’s about understanding the rhythm of the market and moving in harmony with it. Join us as we continue to decode the complexities of time series forecasting, one pattern at a time.